Home Location Inference#
from cider.datastore import DataStore
from cider.home_location import HomeLocator
Load some CDR data, antennas data, and (optionally) spatial files, whose paths have been defined in config.yml. Define the geographic granularity for inference (options are ‘antenna_id’, ‘tower_id’ if a tower_id is provided in the antennas files, or any of the spatial files). Optionally load wealth prediction data to construct a poverty map and ground truth location data to evaluate accuracy.
# This path should point to your cider installation, where configs and data for this demo are located.
from pathlib import Path
cider_installation_directory = Path('../../cider')

datastore = DataStore(config_file_path_string= cider_installation_directory / 'configs' / 'config_quickstart.yml')
home_locator = HomeLocator(datastore=datastore, clean_folders=True)
Loading CDR...
Loading antennas...
Warning: 10 antennas missing location
Filter to a specific date range.
home_locator.ds.filter_dates('2020-01-05', '2020-02-01')
Try running the three different home location algorithms, specifying towers as the requested geographic level of aggregation.
Note
The three algorithms currently implemented are relatively simple; more sophisticate methods to infer users’ home locations do exist.
home_locator.get_home_locations(algo='count_transactions', geo='tower_id')
home_locator.get_home_locations(algo='count_days', geo='tower_id')
home_locator.get_home_locations(algo='count_modal_days', geo='tower_id')
| subscriber_id | tower_id | count_modal_days | |
|---|---|---|---|
| 0 | JGPCbfDGes | t35 | 4 |
| 1 | YtvkGlMWwe | t39 | 4 |
| 2 | dYwshzRseD | t26 | 4 |
| 3 | dsBHAdXrrk | t35 | 2 |
| 4 | ygMEXUQDbn | t27 | 4 |
| ... | ... | ... | ... |
| 995 | amzyXHglBx | t7 | 3 |
| 996 | dJSvXqUVSY | t64 | 3 |
| 997 | ptudOnjdRU | t35 | 5 |
| 998 | uXZrufHOmE | t79 | 4 |
| 999 | zZkqaZFAtz | t80 | 4 |
1000 rows × 3 columns
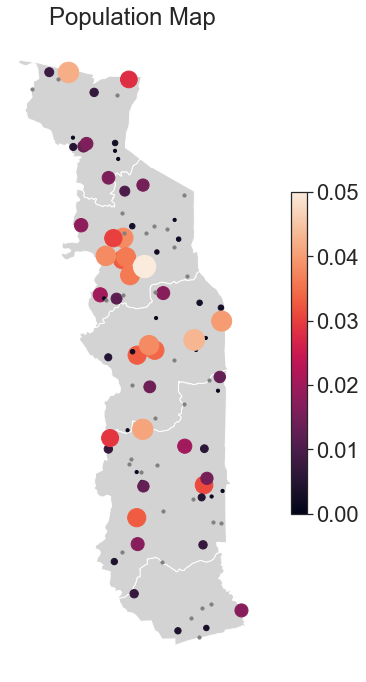
Generate a population map based on inferred home locations using the unique days algorithm. Use points at each of the tower locations.
home_locator.map(algo='count_days', geo='tower_id', kind='population', voronoi=False)
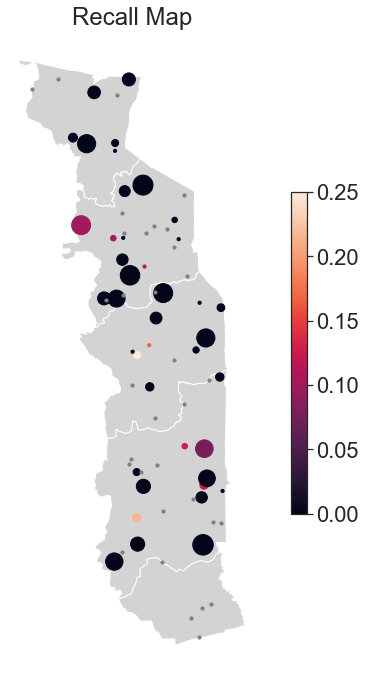
Evaluate the accuracy of the home location inference using the ground truth data. Generate maps and a table of precision and recall for each tower.
home_locator.accuracy(algo='count_days', geo='tower_id')
home_locator.map(algo = 'count_days', geo='tower_id', kind='recall', voronoi=False)
Observations with inferred home location: 1000 (1000 unique)
Observations with ground truth home location: 1000 (1000 unique)
Observations with both: 1000 (1000 unique)
Overall accuracy: 0.02
home_locator.accuracy_tables[('tower_id', 'count_days')].head()
| tower_id | recall | precision | overall_accuracy | |
|---|---|---|---|---|
| 67 | t7 | 0.076923 | 0.166667 | 0.017 |
| 15 | t22 | 0.250000 | 0.142857 | 0.017 |
| 33 | t39 | 0.214286 | 0.090909 | 0.017 |
| 66 | t69 | 0.100000 | 0.055556 | 0.017 |
| 37 | t42 | 0.153846 | 0.055556 | 0.017 |
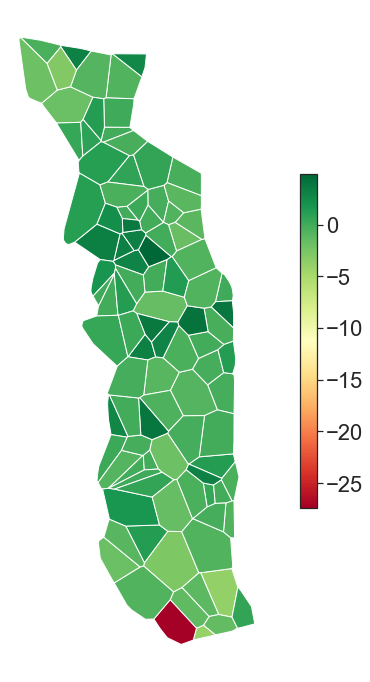
Use population density maps to identify which areas are over/under-represented in your sample.
home_locator.pop_comparison(algo='count_days', geo='tower_id')